When I first picked up Ansible Semaphore , I expected a simple UI wrapper around playbooks. I ended up going down a few rabbit holes due to the scarcity of online presence about it in blogs, and the documentation is more of an overview than a deep dive documentation site.
So, getting beyond the basics took a lot more trial and error than I really would like to admit:
This post is meant to shortcut that learning curve. It focuses on how Semaphore handles credentials, how to structure projects so you don’t go around in circles, and at the end I chained it with tools like Lynis for quick hardening checks to prove effectiveness. This playbook pushes Lynis results into Prometheus for graphing with Grafana without juggling files by hand.
I’m not covering how to install any of these tools because that information is everywhere on the internet, and I don’t see the value in explaining how to set it up. What matters is how they fit together in a real setup: Semaphore triggering a playbook, Lynis producing an audit report, and Prometheus scraping a clean metric that tracks over time. That’s the part I couldn’t find laid out anywhere, so that’s what this post tries to make clear.
You can find my Ansible repository here:
Control Plane Architecture #
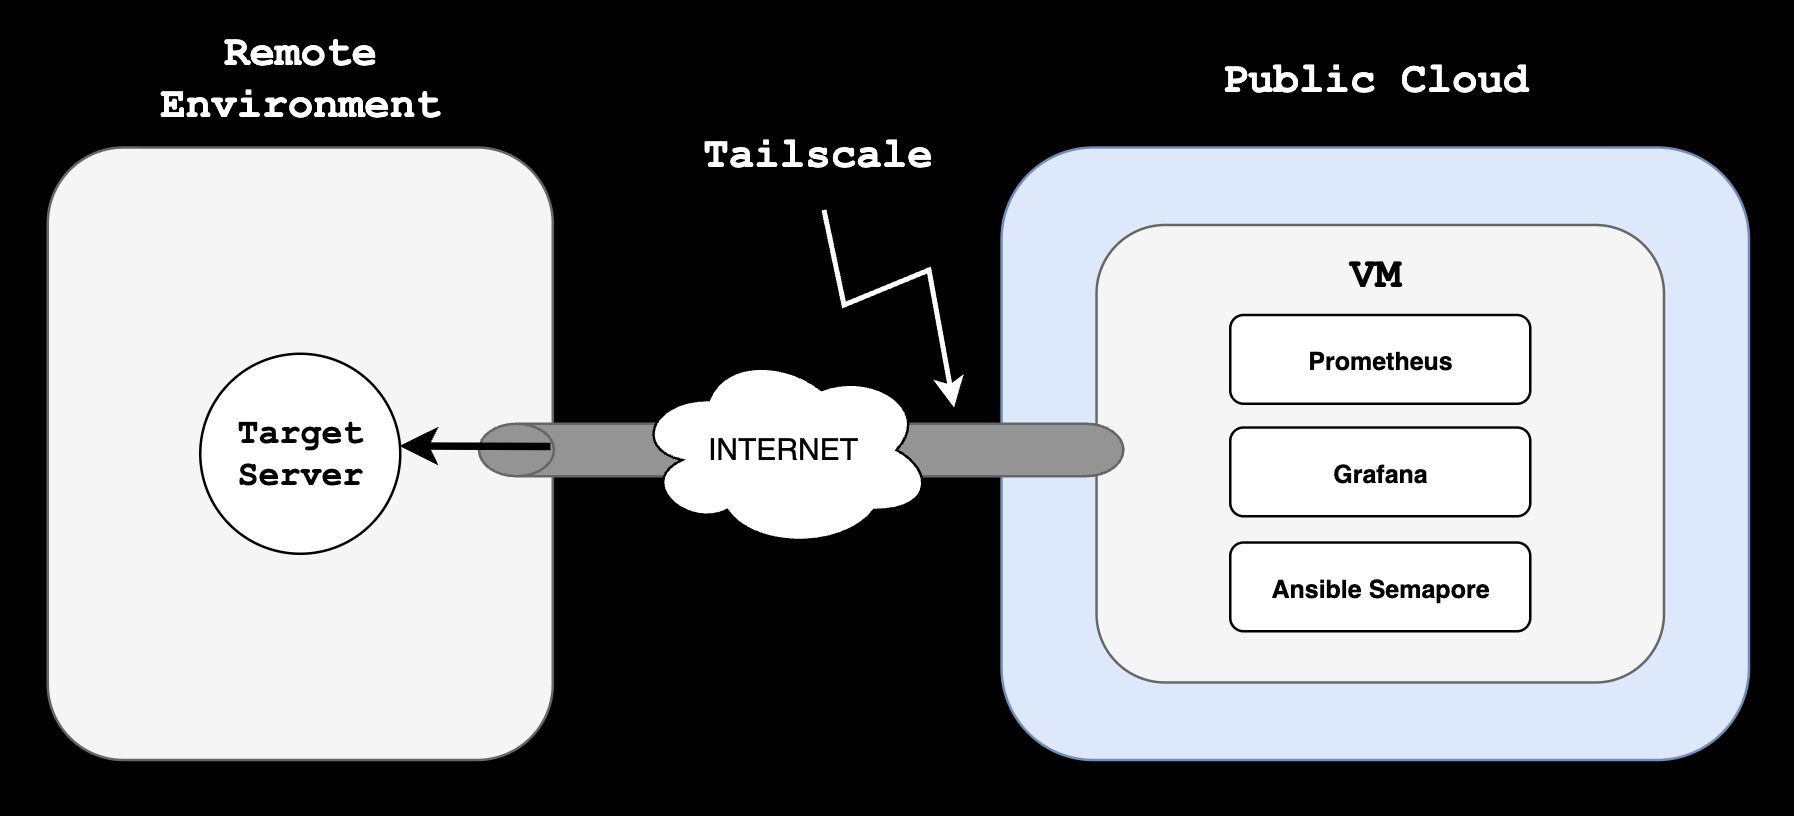
At a very high level, and hoping it could get you some ideas for similar implementations or needs you might have, the following diagram shows how this specific design works. I am abstracting surrounding systems, other networks, and just stripping out everything that this post is not about.
The Control Plane, the server in which Ansible, Prometheus and Grafana live, is in a Public Cloud environment, in a single VM, connected to a Tailscale Tailnet, also extended to my target Ansible nodes. Tailscale gives me a private mesh overlay. To make it truly Zero Trust, I rely on ACLs to restrict which nodes can talk to each other.
So with this explained, let’s get started with the actual configuration of Ansible Semaphore.
Credential management #
In my opinion, the biggest design criteria one needs to have in Ansible, is how to group assets together in a cohesive way. We can have 1 inventory with every asset we handle, separated by groups, or we can have a lot of inventories to separate environments, host groups, etc.
Semaphore doesn’t let you attach a variable group directly to an inventory. Instead, variable groups are attached to tasks, so the task becomes the link between the secrets and the inventory.
I found this confusing at first, since it needs some backwards thinking but it can be thought this way:
- I created 1 Variable Group with secrets (Key + value store), that will be used later in the task (Image below).
- Inventory (Next section) uses the values of such Var group by referencing their Keys.
- Tasks (Third section of this post) reference 1 Var Group (The one I created) only, so inventory successfully references the Key/value pairs of the Var Group’s secrets.
Creating 1 Key + Value pair in Var Groups. The SSH password will be referenced in the inventory by Key, “test_server_password”:

Host Grouping #
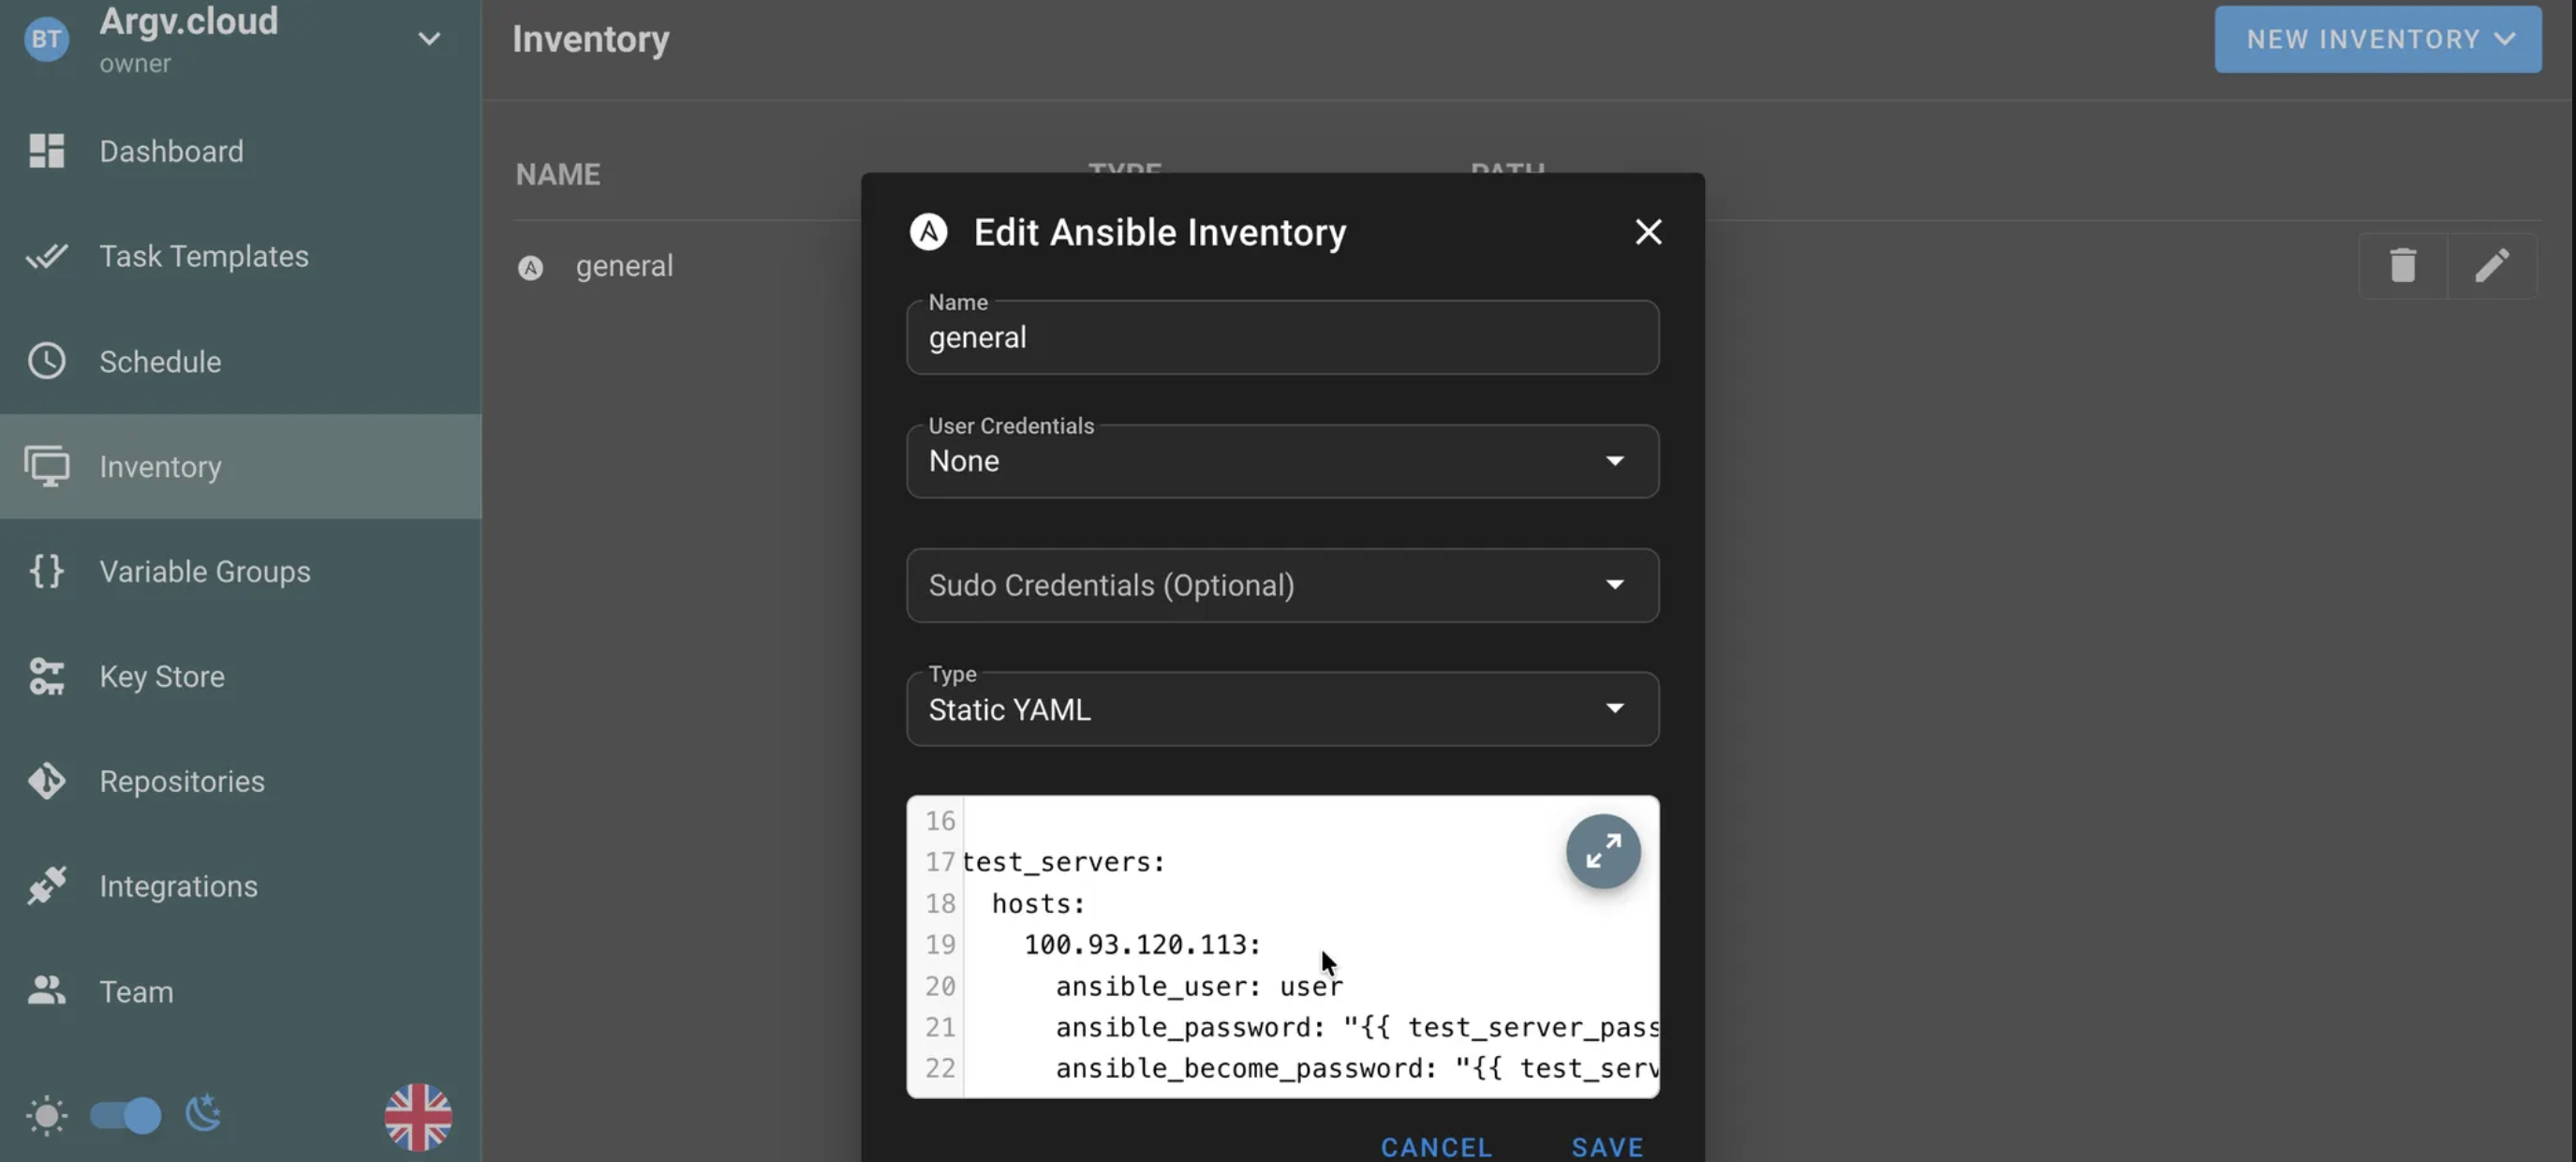
At the inventory level, we can nest this values inside the YAML file, to reference this keys from the Var Group.
I am assigning the variable keys, directly in the inventory under this host. This makes sense, since the value of the key would get referenced from our variable group.
test_servers:
  hosts:
    100.93.120.113:
      ansible_user: user
      ansible_password: "{{ test_server_password }}"
      ansible_become_password: "{{ test_server_password }}"
test_serversgroup, is referencing, under the host100.93.120.113, its password via variables.
This inventory is not yet “linked” to the variable group yet (And that’s the trick of this implementation). When we create our task template, that’s where we’ll “assign” the var group to the inventory.
This solves the problem of shooting 1 task template for different hosts with obviously different credentials. We just need 1 Variable Group (Else we’d need to create different task templates for different host groups, even if the task is the same).
I am leaving the “User” and “Sudo” credentials empty in the inventory:
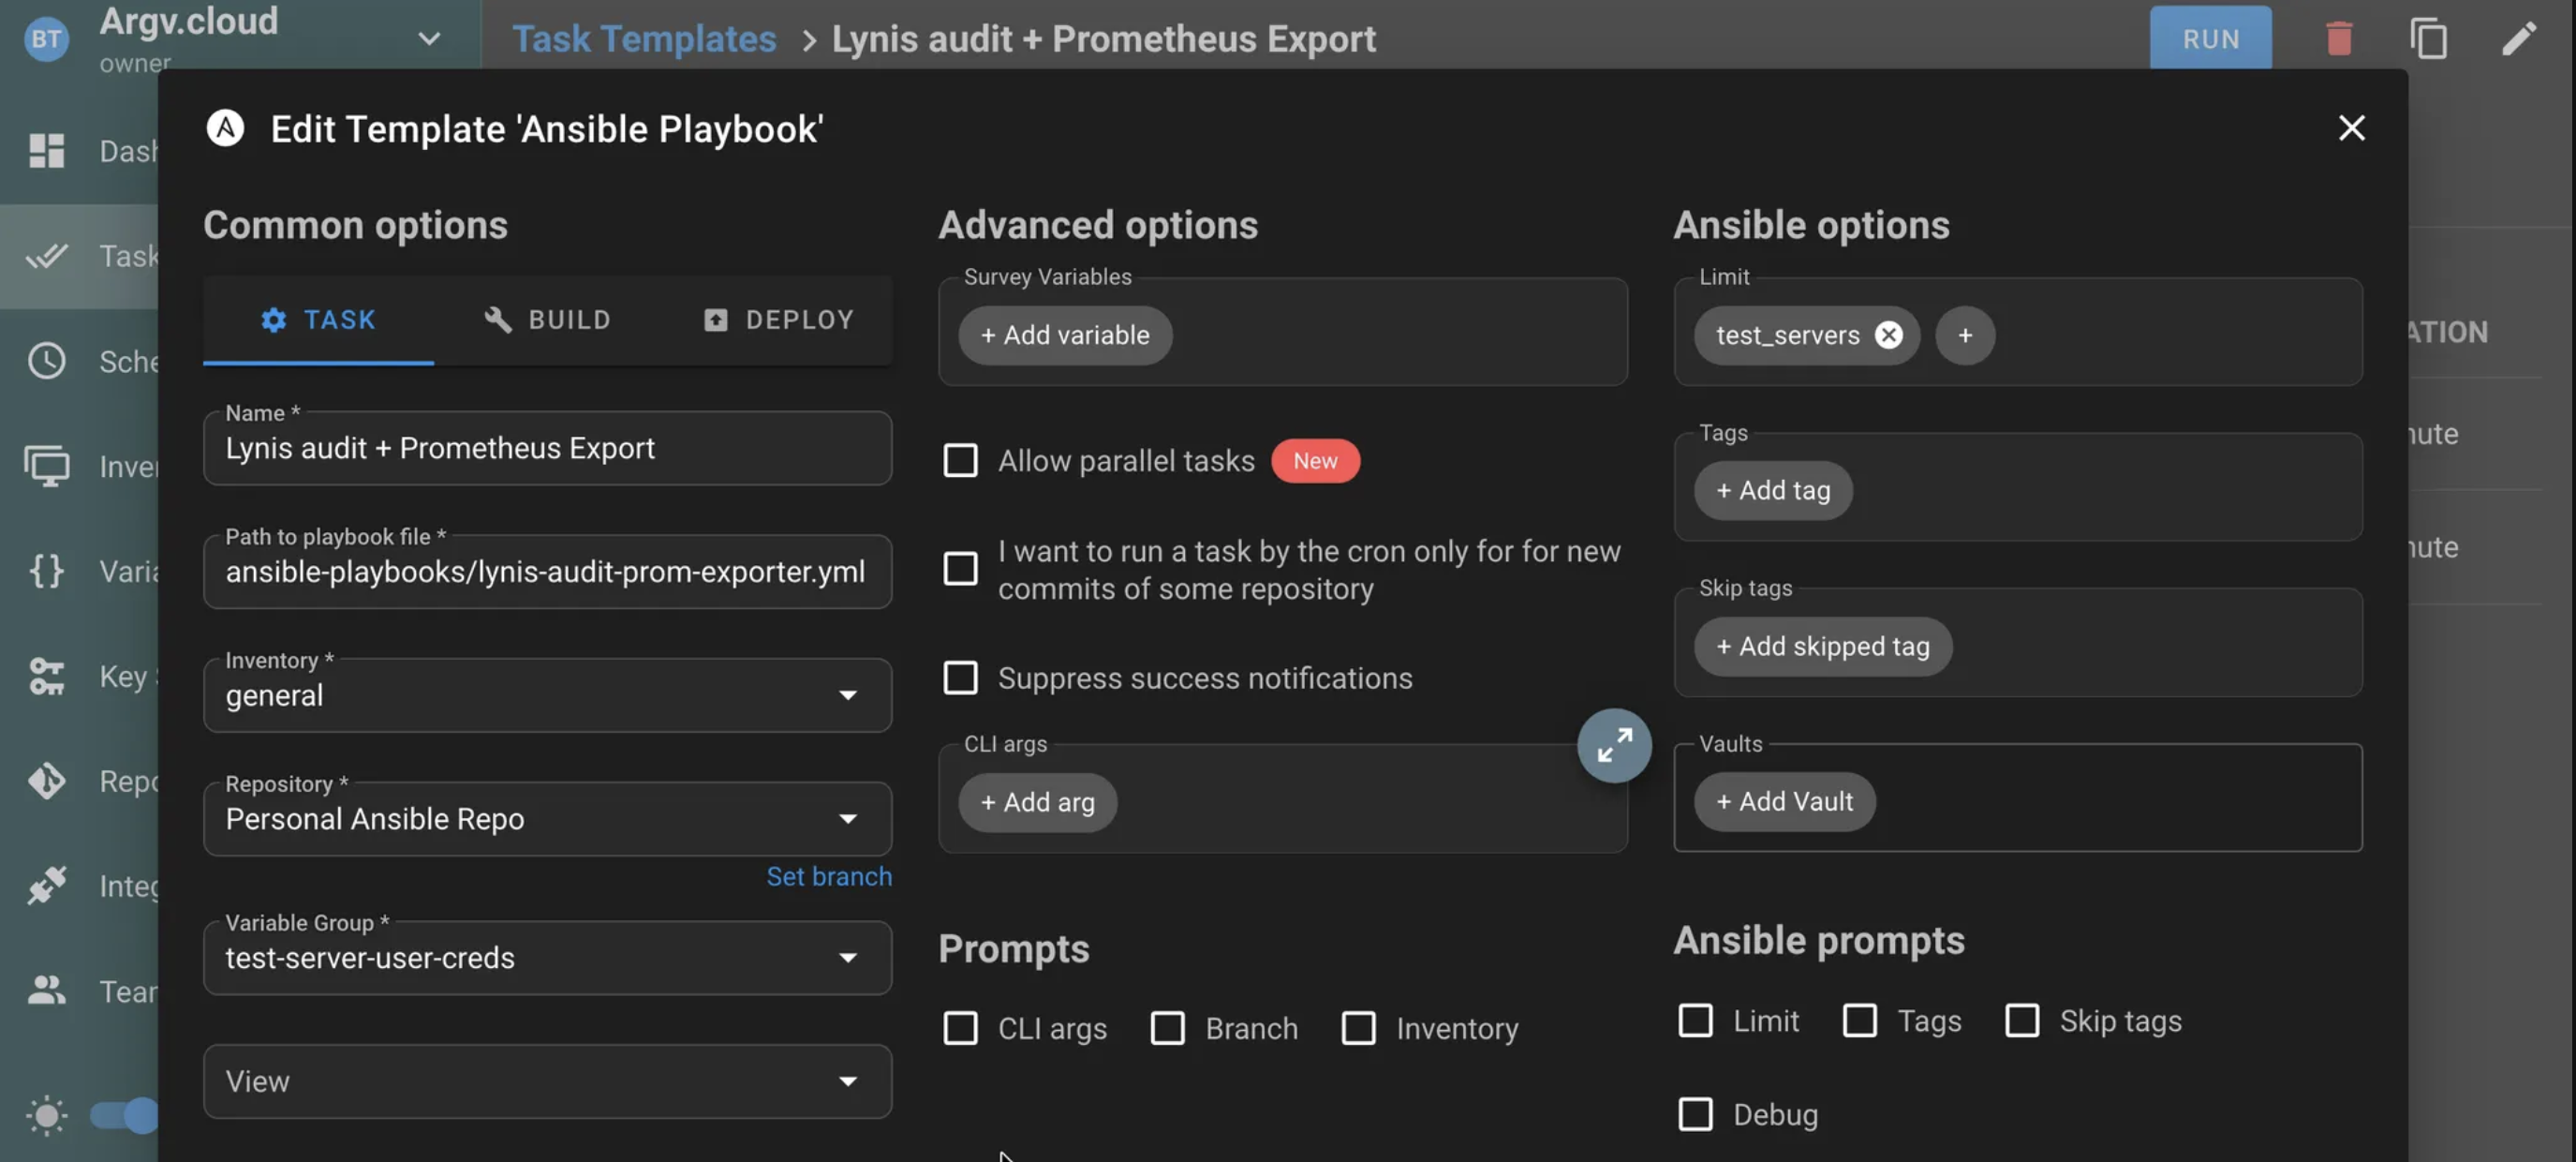
“Limit” #
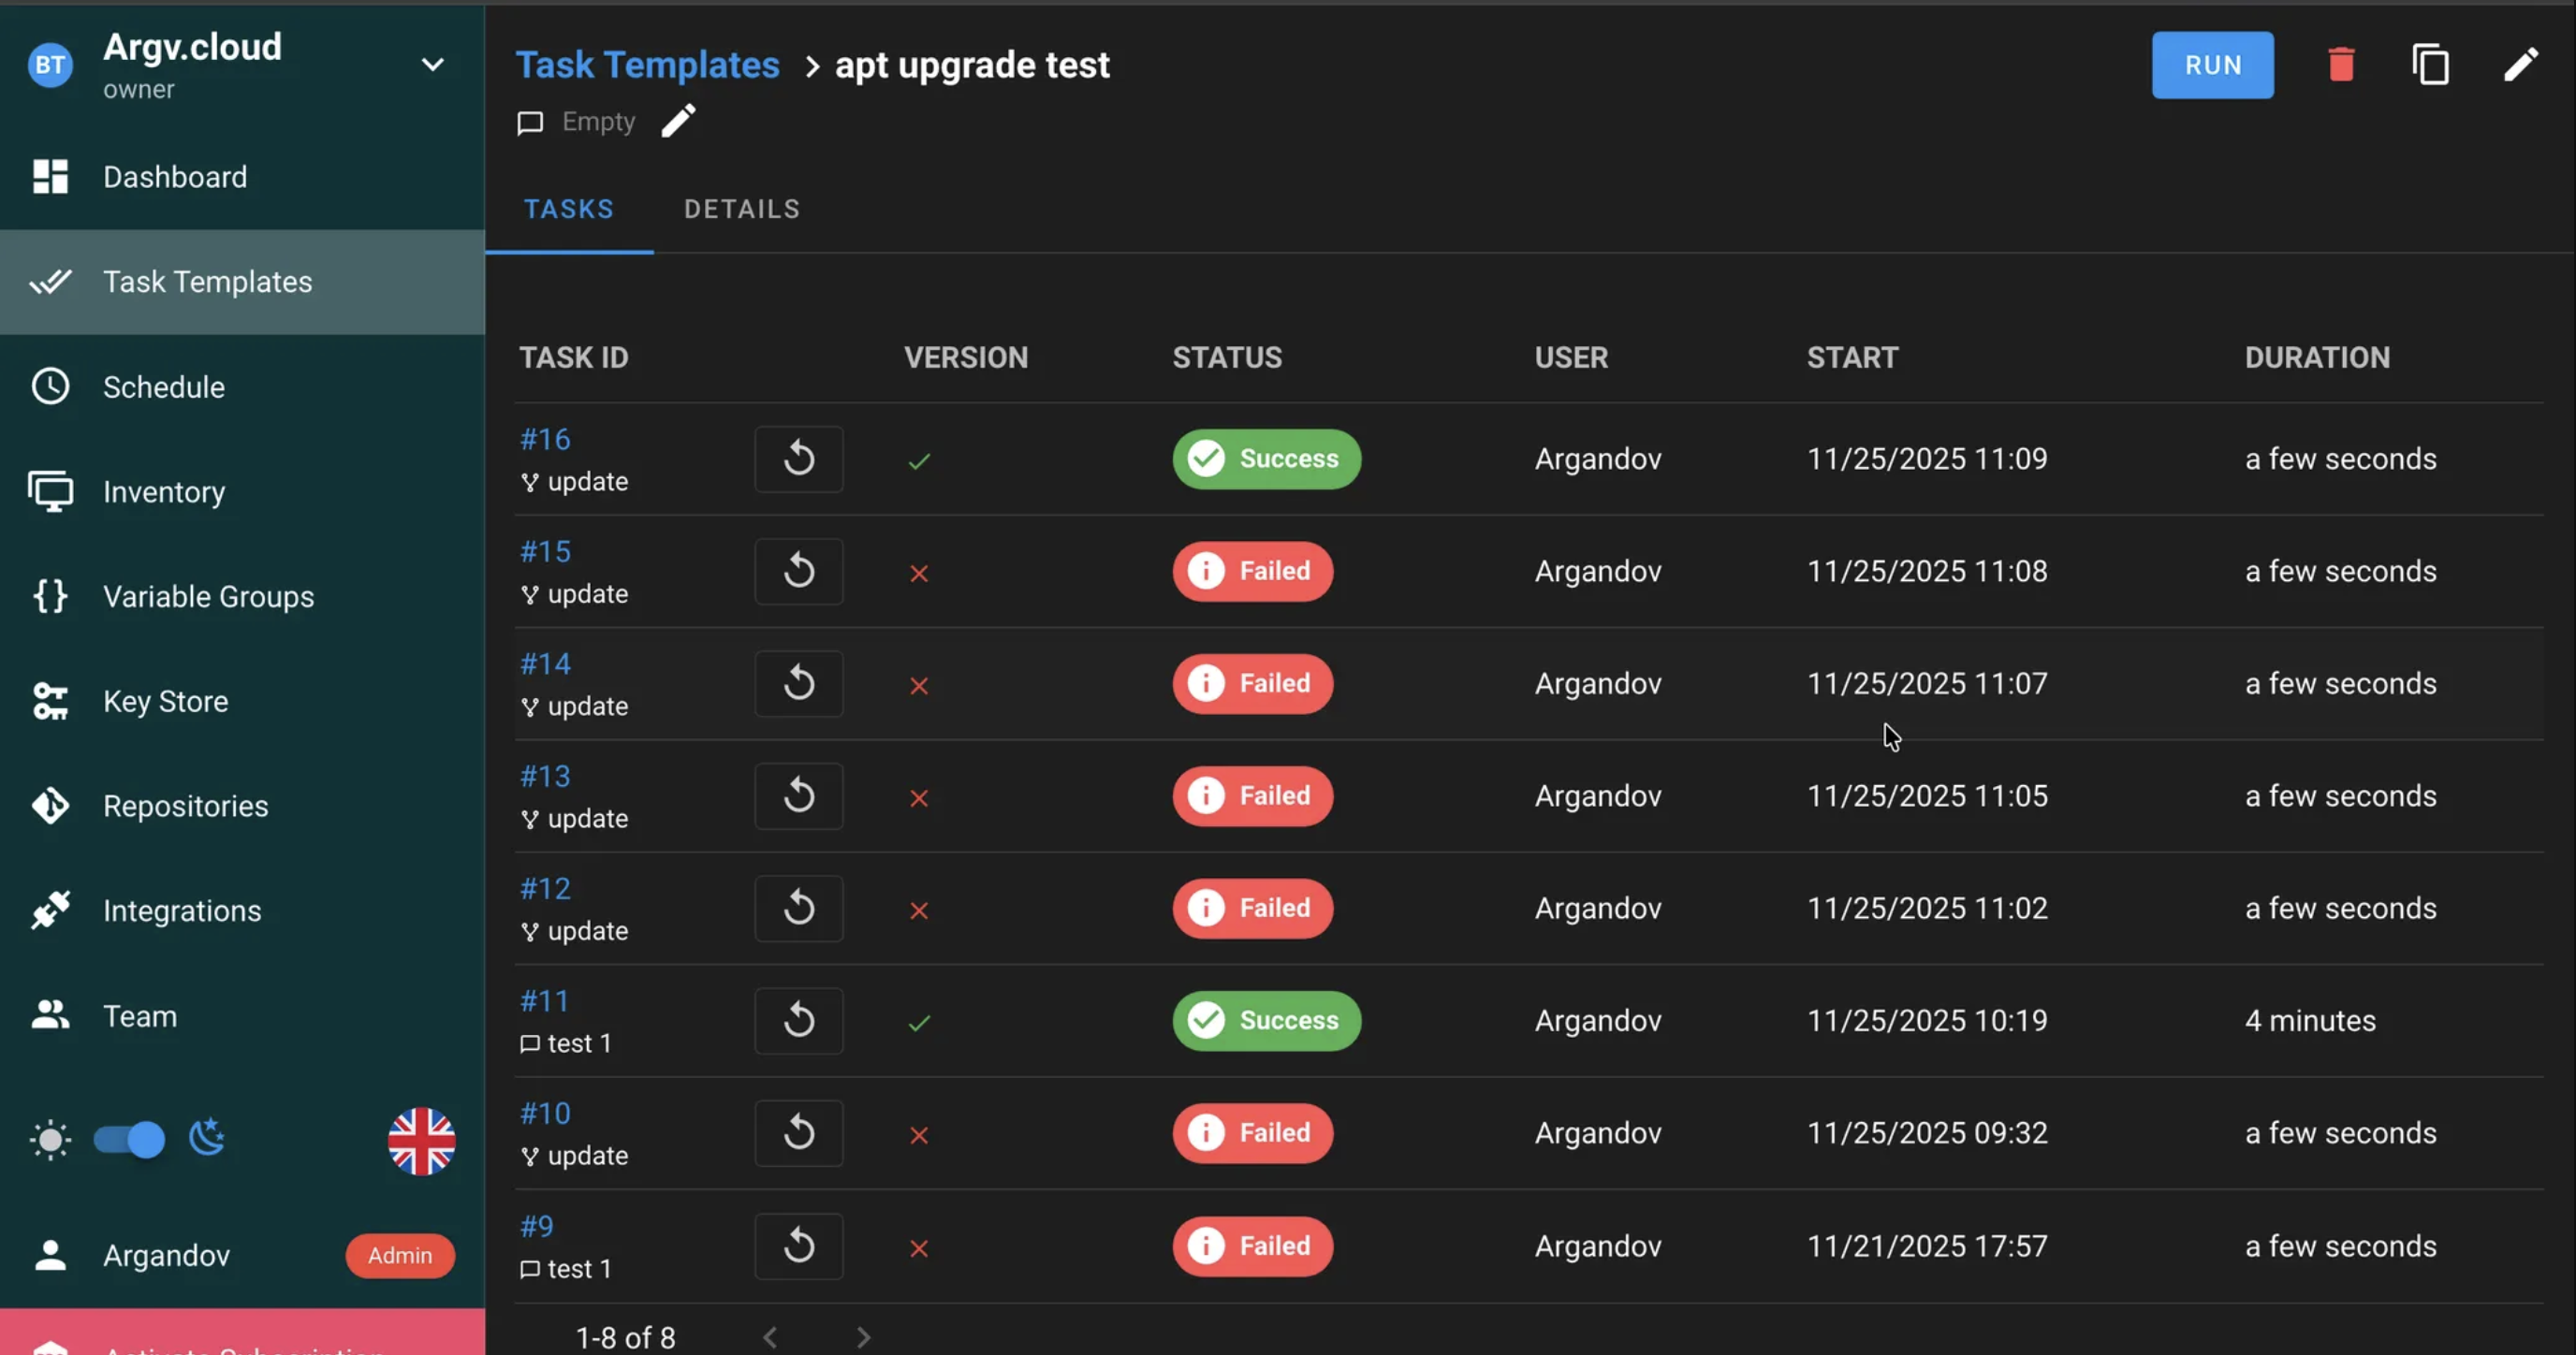
For this controlled test, I will set the Limit (This one took me a while to figure out as well) to “test_servers” so I only launch my Lynis audit + Prometheus exporter playbook to this server group (In this case, it’s just 1 server):
Of course, scheduling this task is not discussed here, as it’s trivial and the criteria may vary. I would say once a week is a good start, since Linux configuration is not something that changes that quickly (Much less the actual hardening of the system. That’s not an easy and fast thing to do). I don’t see any benefit from running it more often. Maybe running such scans ad-hoc after performing big sprints of hardening to the system would make sense, and leaving the once-a-week scan as it is.
The playbook I’m running: the Lynis + Prometheus task #
Here I am adding a demo of actually running an Ansible playbook against 1 test host.
This playbook does a few things:
- Downloads Lynis,
- Executes it and extracts the Hardening Index, which luckily is an Integer and can be parsed from Lynis’ output.
- Expose the Security Hardening index as a metric in Prometheus (Prometheus needs to be already installed on the system)
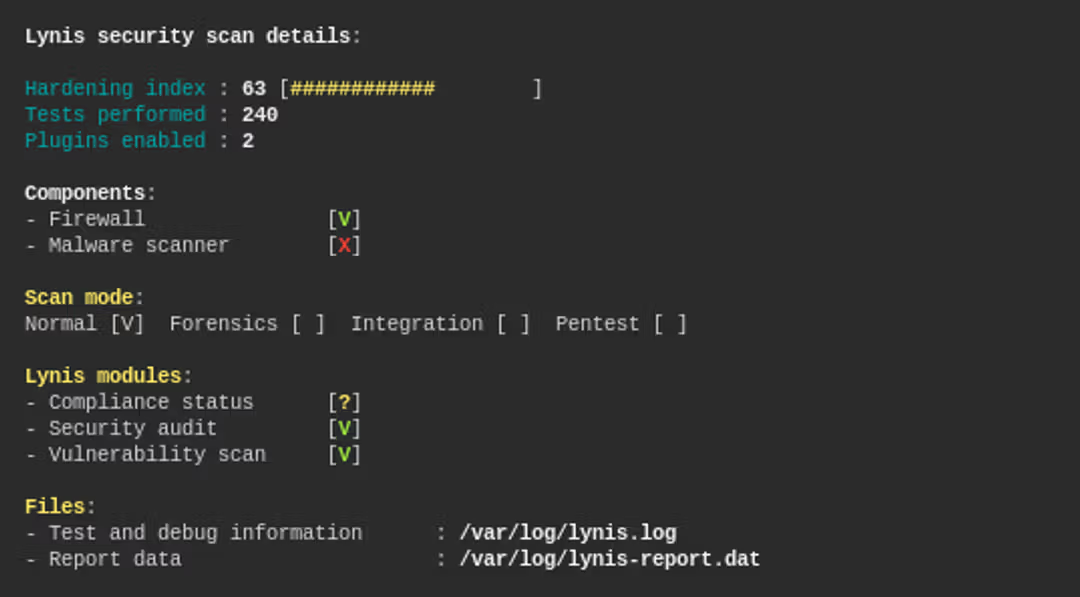
if you’ve worked with Lynis in the past, you may have seen the Hardening Index as the single most important piece of data to make sense of the whole report. It’s THE metric for Lynis’ output:
The results #
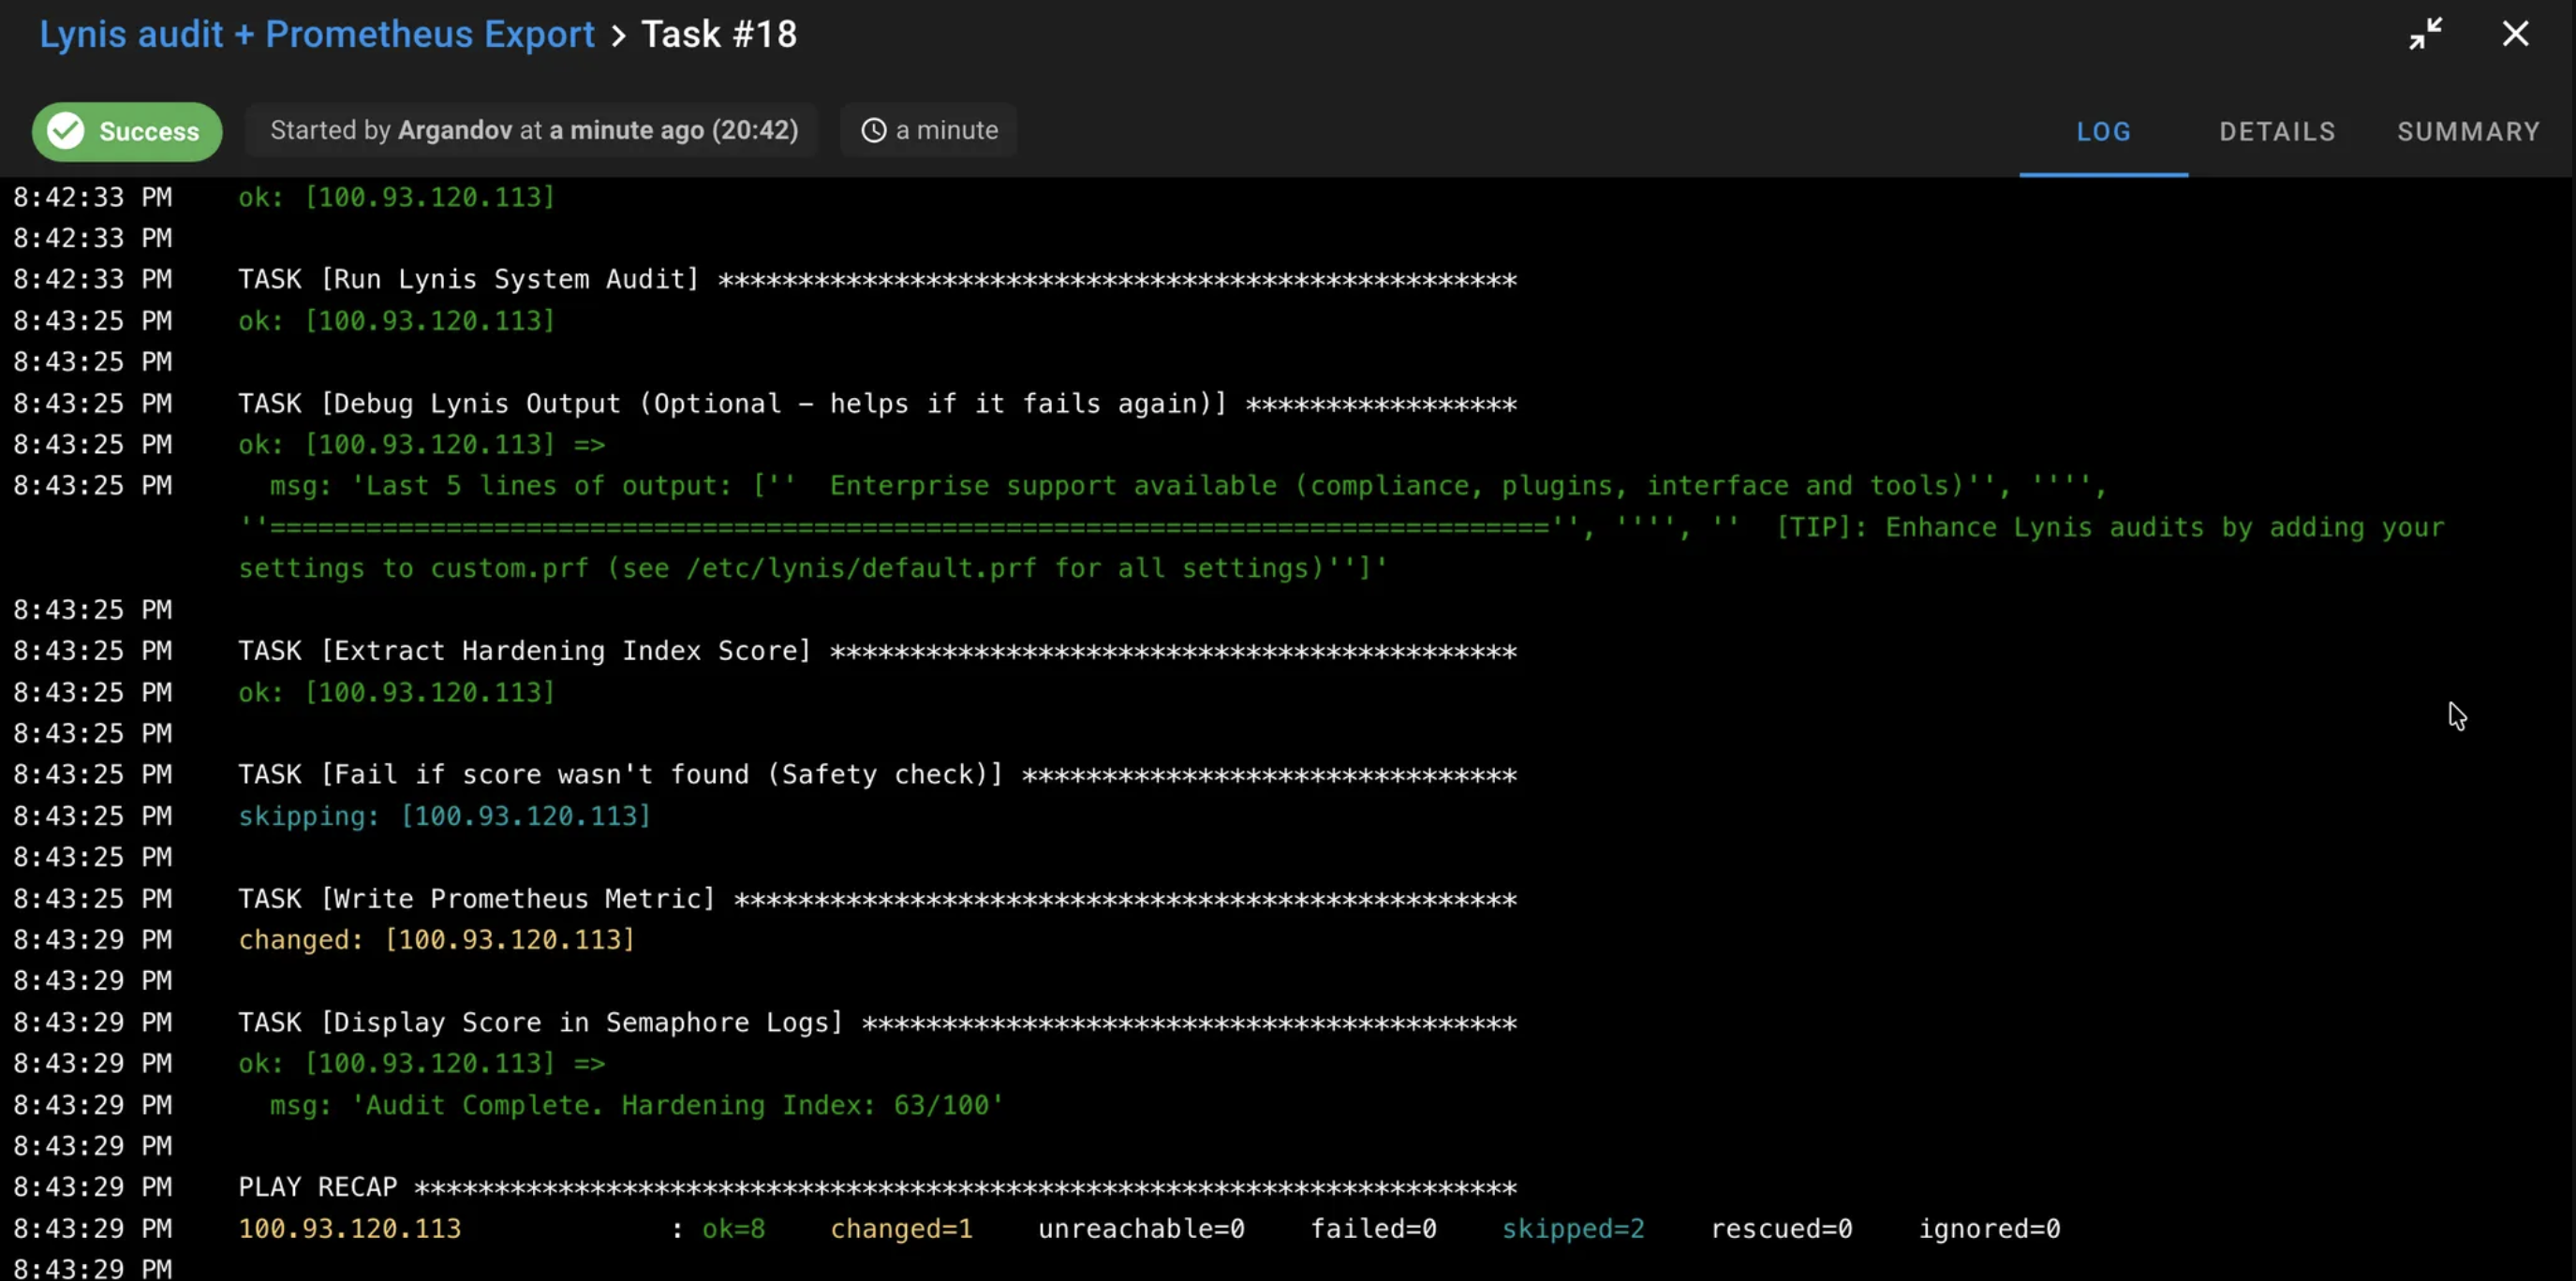
Successfully ran the actual playbook against my “test_server” group:
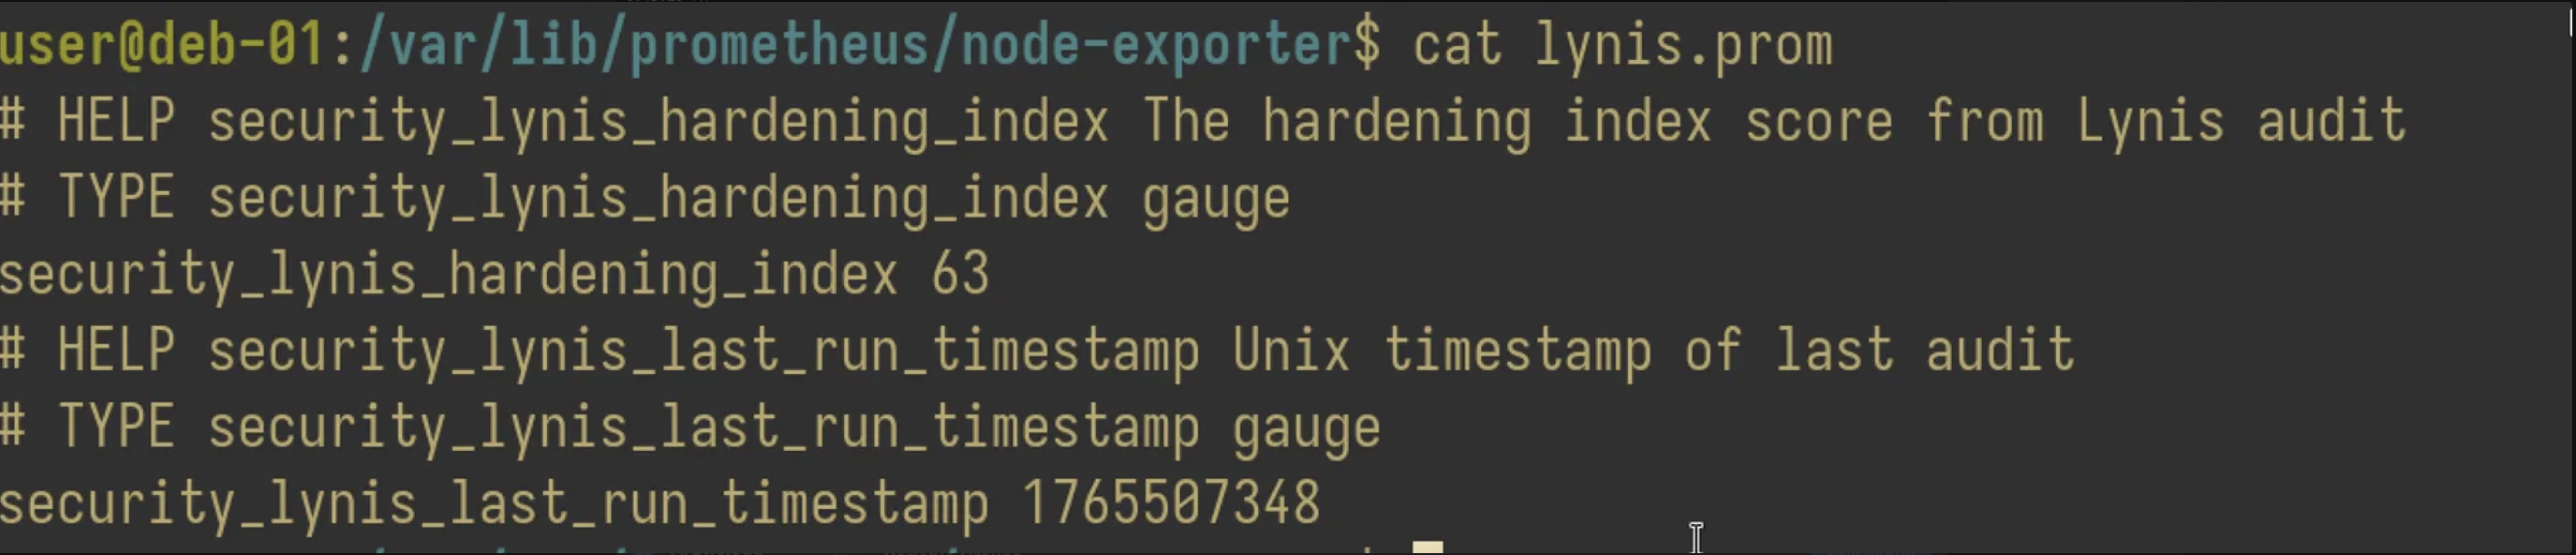
And I can find the Prometheus metrics already exposed in the target server:
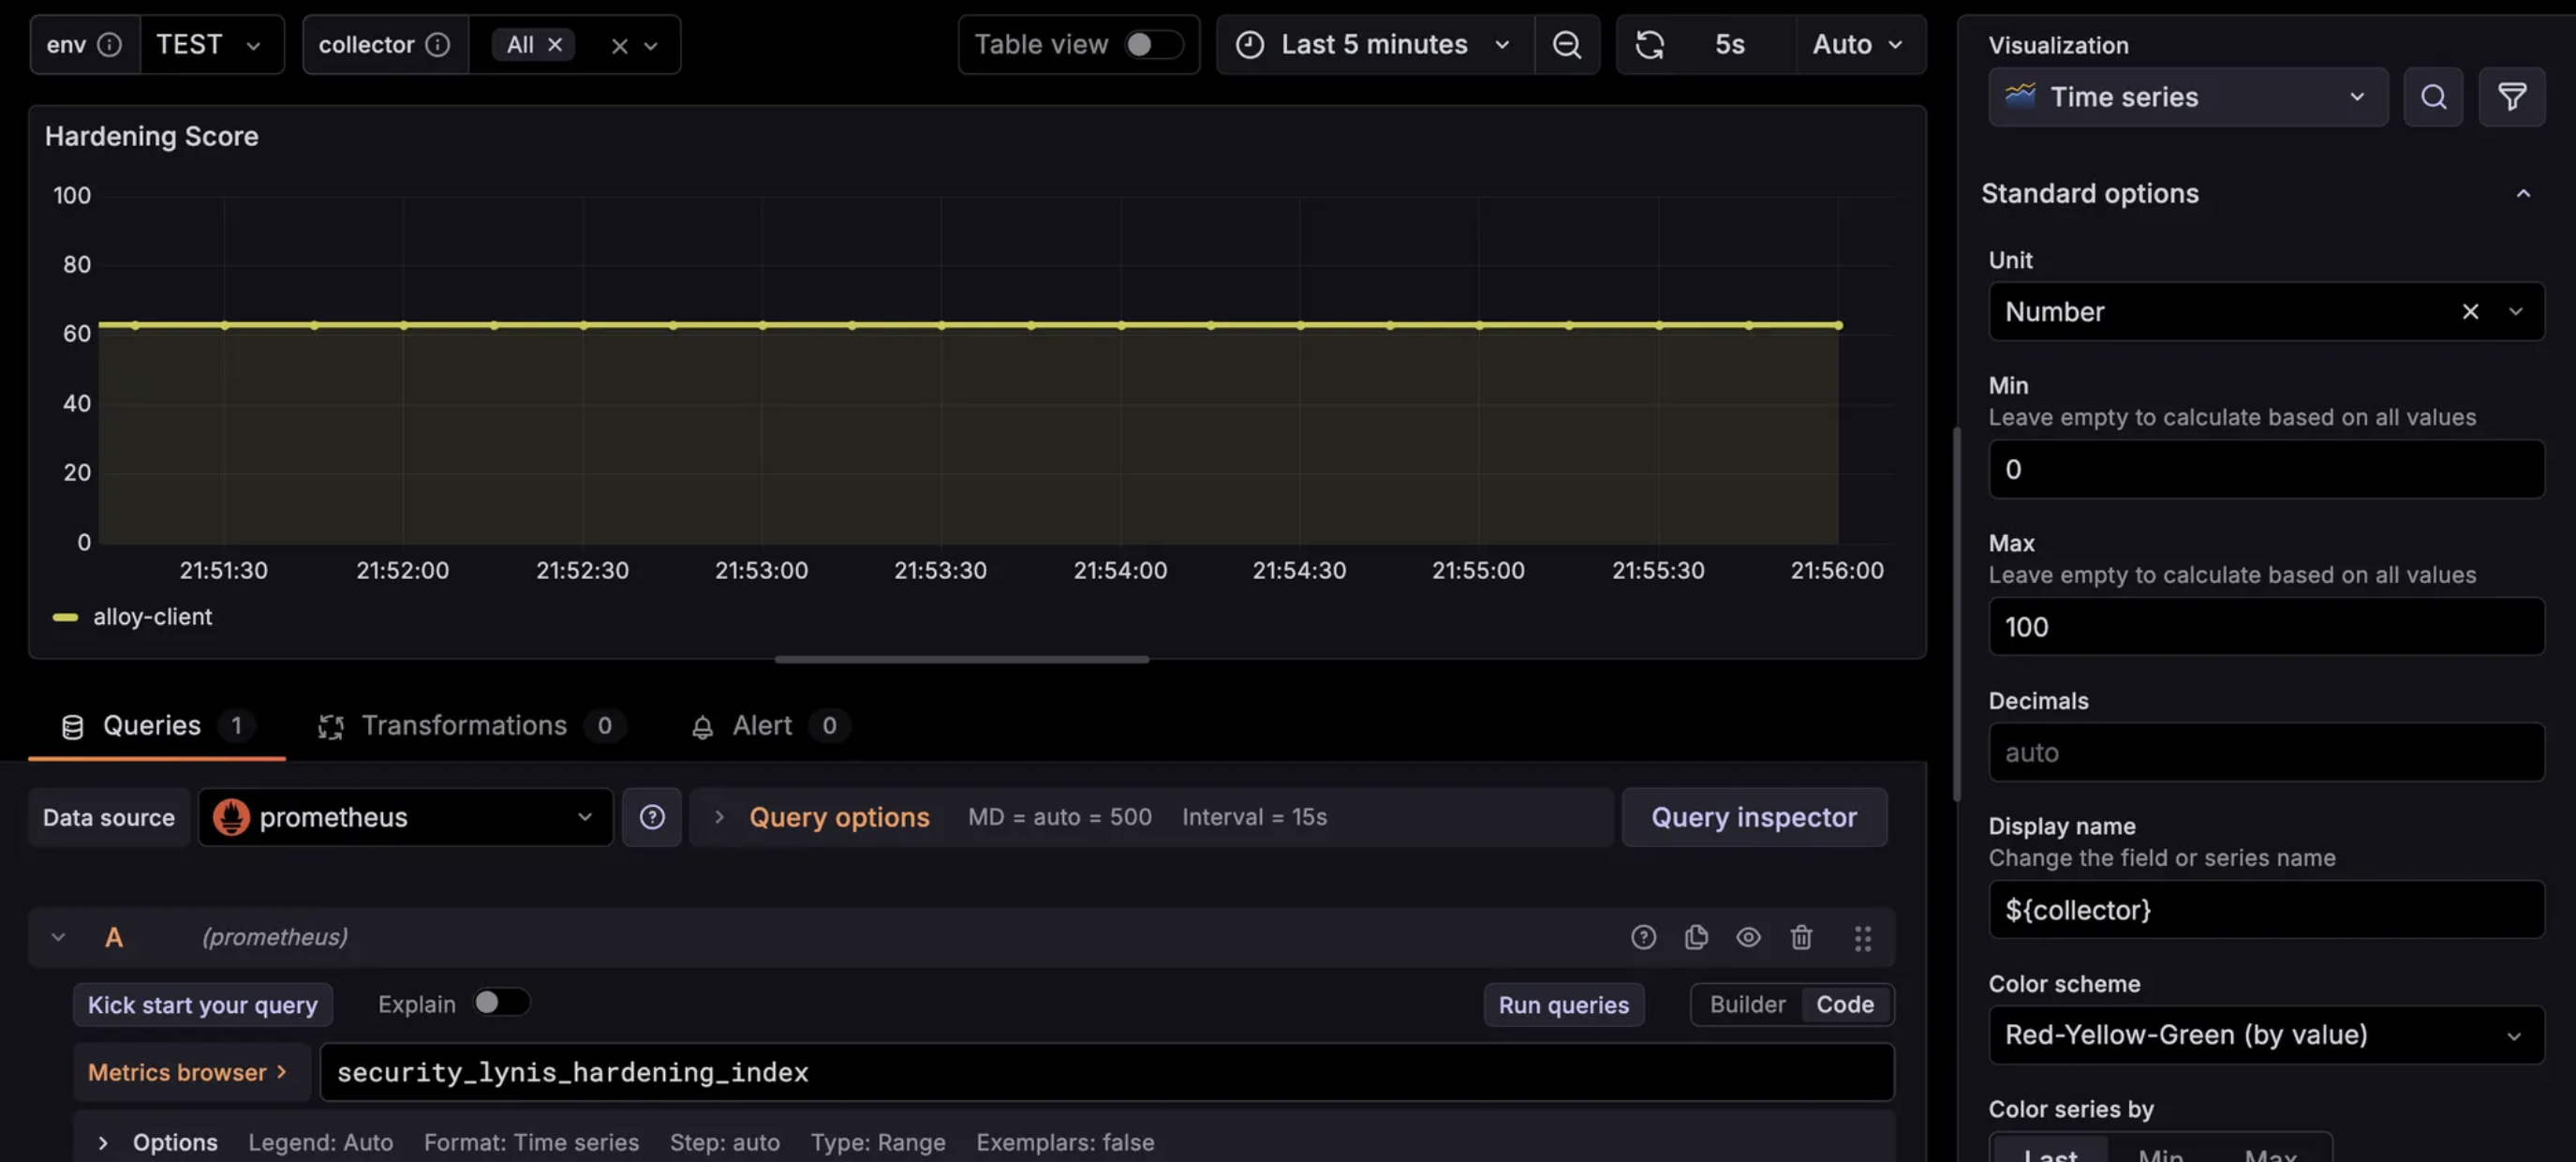
Finally, the Grafana dashboard with a panel that references this Hardening index. This can be very useful in order to see the configuration drift over time:
That’s it for this post. The management of remote nodes gets covered, and a journey of observability actually begins with Grafana, Loki, Alloy, Prometheus, etc. And it’s a deep rabbit hole…